How the services offered by the EECITIES portal can be used to identify which refurbishment options offer the greatest impact in terms of carbon reduction at city level is explained here.
The user is a non-specialist working either in planning or in another task concerned with urban energy performance. S/he is working for a public authority interested in boosting the reduction of carbon emissions by increasing the energy efficiency of buildings in the city, using local subsidies.
Using the SEMANCO platform the user can propose different measures to improve buildings. The results of applying the measures at large scale can be compared using pre-defined indicators. The outcomes of this process will help the user inform his/her management how use available funds in the best way to meet their organisations targets.
The steps in this process are outlined below:
1. Choosing the area and selecting the corresponding Urban Energy Model (UEM).
The city where the user is working and the rules for calculations (data and tools) are selected.
1.1 Select the area and the UEM
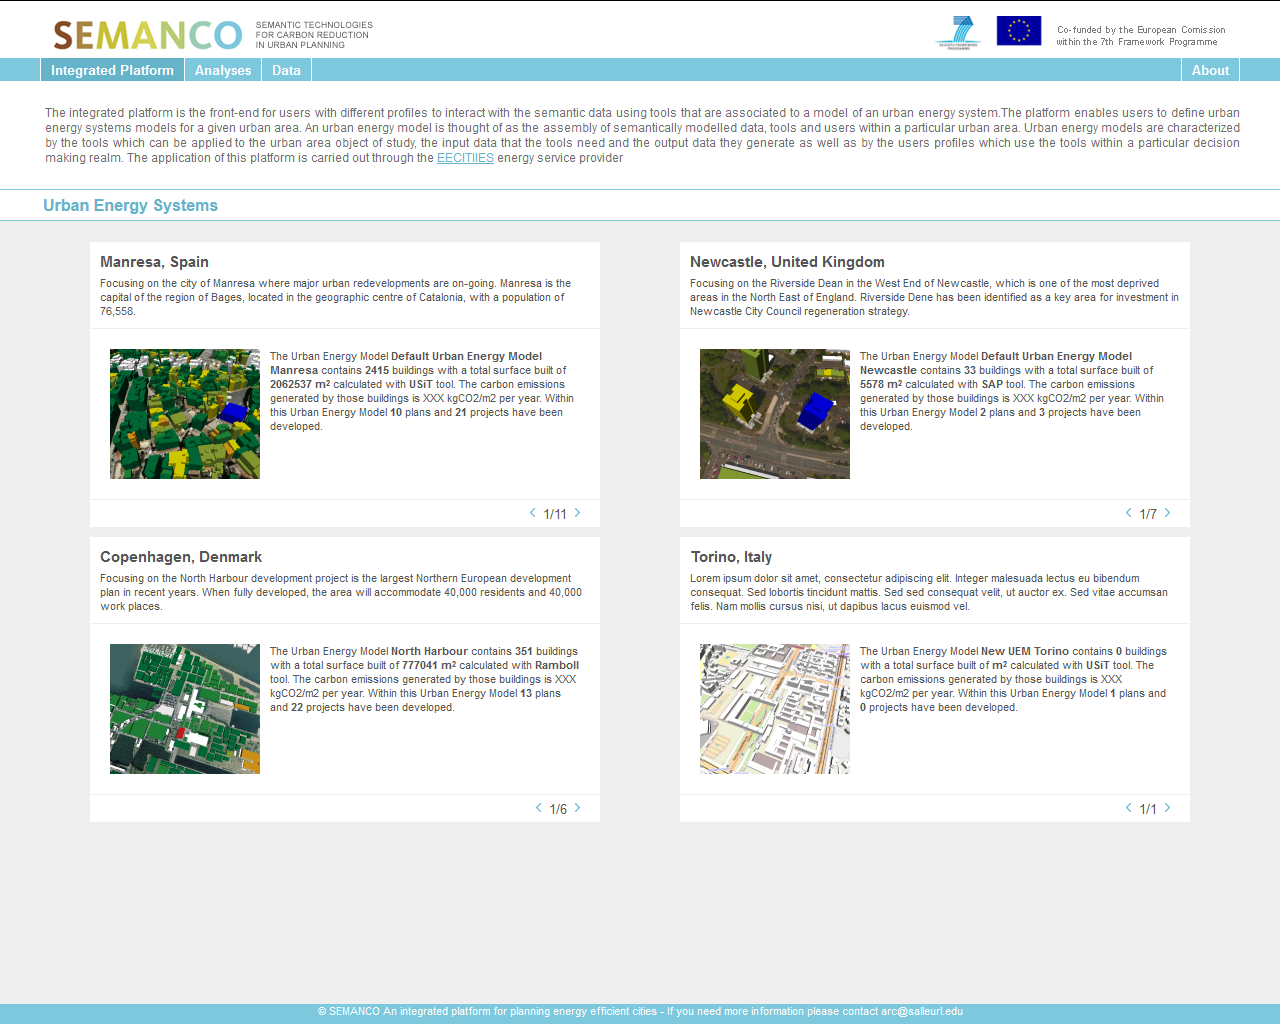
The user selects both the city and the specific Urban Energy Model (UEM) from the main screen and logs into the platform. The UEM defines the rules to perform the evaluation. The UEM has been set previously by selecting the appropriate data and tools for the purpose of the study. The one selected in this case is based on URSOS calculation engine with a pre-calculated baseline of the current city performance
2. Focusing on a particular area to be refurbished.
An area illustrating buildings with high energy demand is identified navigating through the pre-calculated baseline.
2.1 Analysing data at urban level
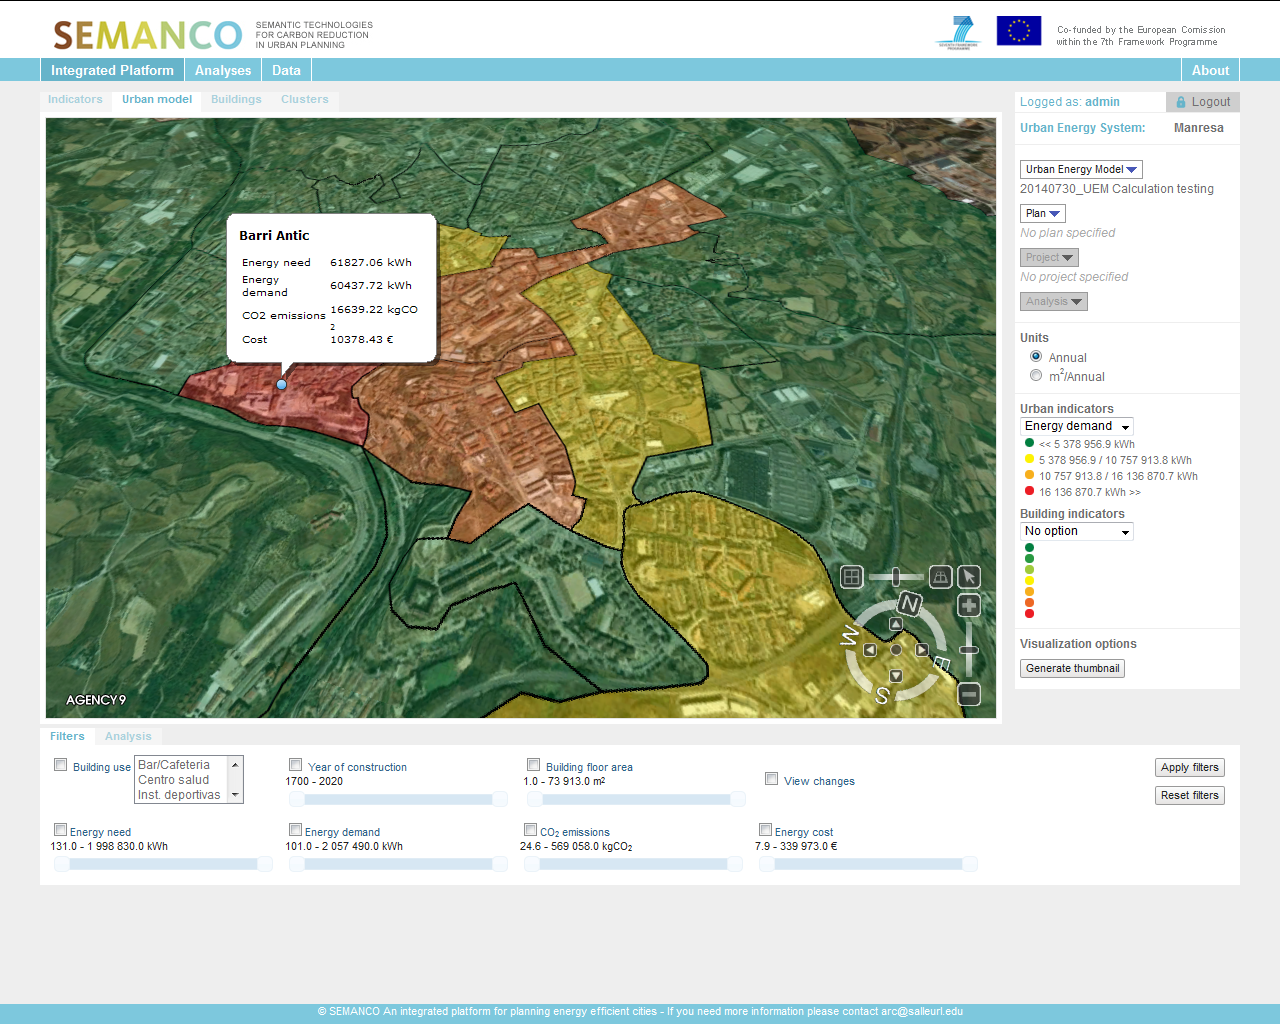
By zooming in the 3d model, the user reaches the view scale for which urban indicators are activated. The neighbourhoods are coloured according to the energy demand. The user focuses on “Barri Antic” and “Vic Remei”, which are highlighted as the most energy intensive neighbourhoods. The user knows that this makes sense, since those are the neighbourhoods with the oldest buildings in the city. Reviewing the values appearing that appear in the panels after clicking on an area, the user decides to zoom into the “Barri Antic” one, until reaching the building level view.
2.2 Analyzing data at urban level
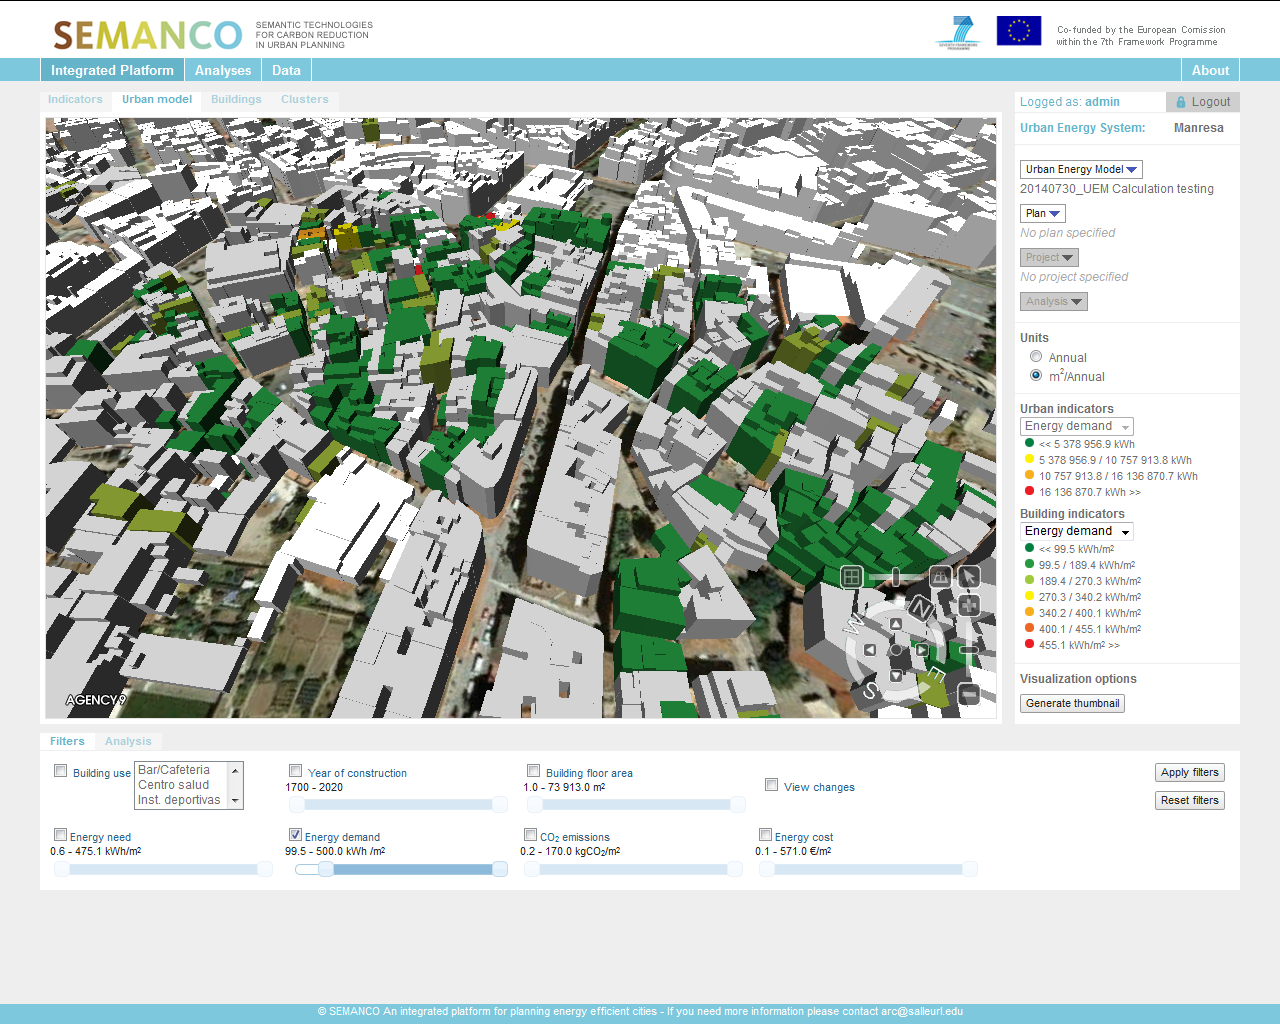
The user takes the “Energy demand” indicator as reference. Using the filter feature, the user removes the best performing buildings from the selection. The customized view of the data depicts enables the identification of the areas where the worst performing buildings are concentrated. Now the user is able to detect a highly coloured zone. Thus, he/she decides to use this group of buildings as to test potential refits.
3. Setting up the renovation plan.
A plan is set, including the buildings that will be used for the purpose of the analysis.
3.1 Creation of a new Plan
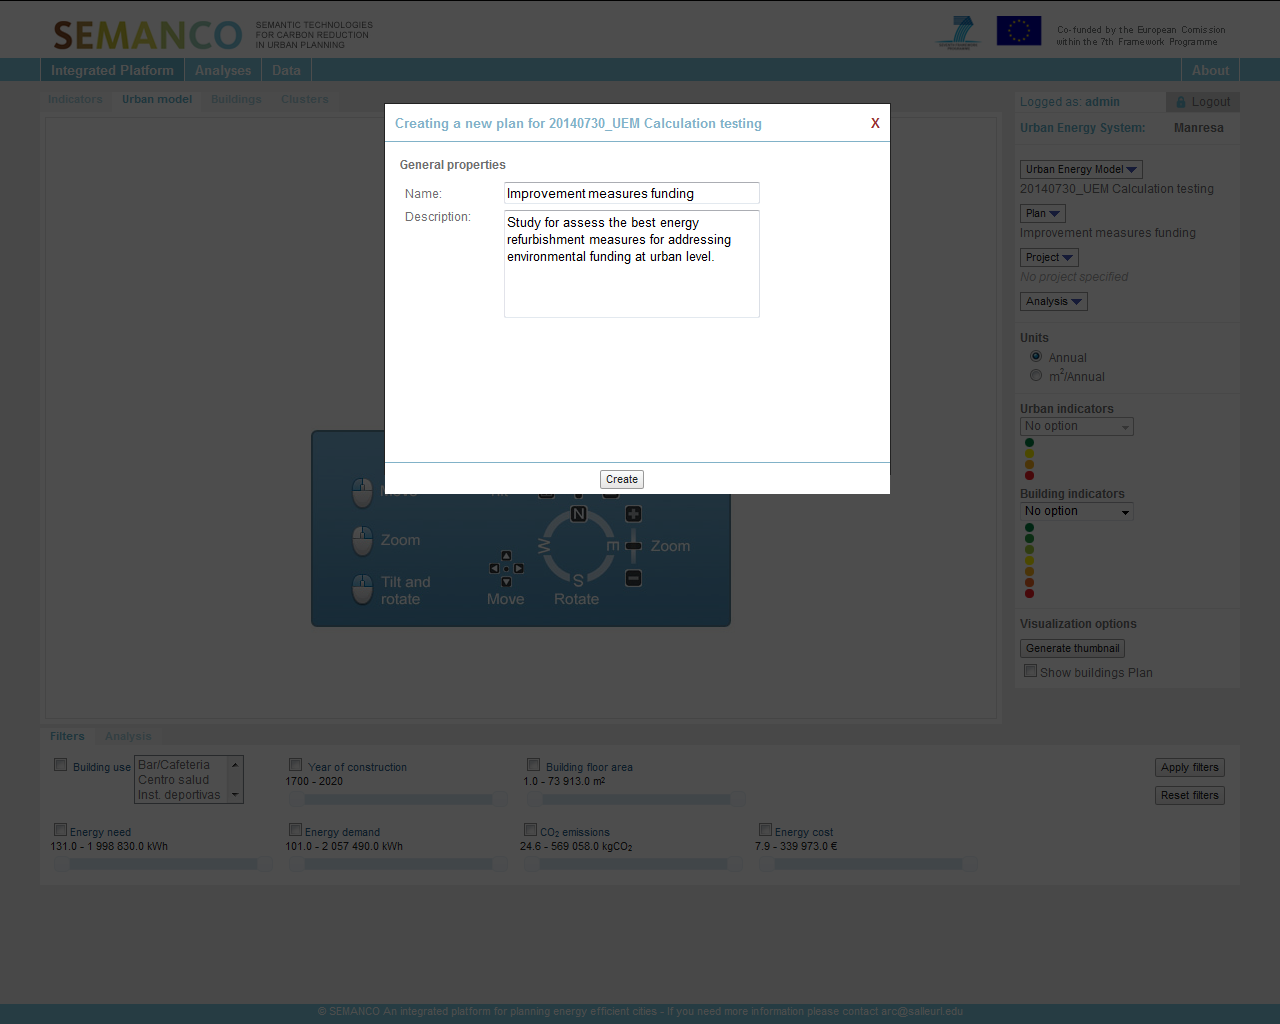
The user creates a new plan by providing the required name and description. The name assigned to the plan is “Improvement measures funding”.
3.2 Addition of buildings
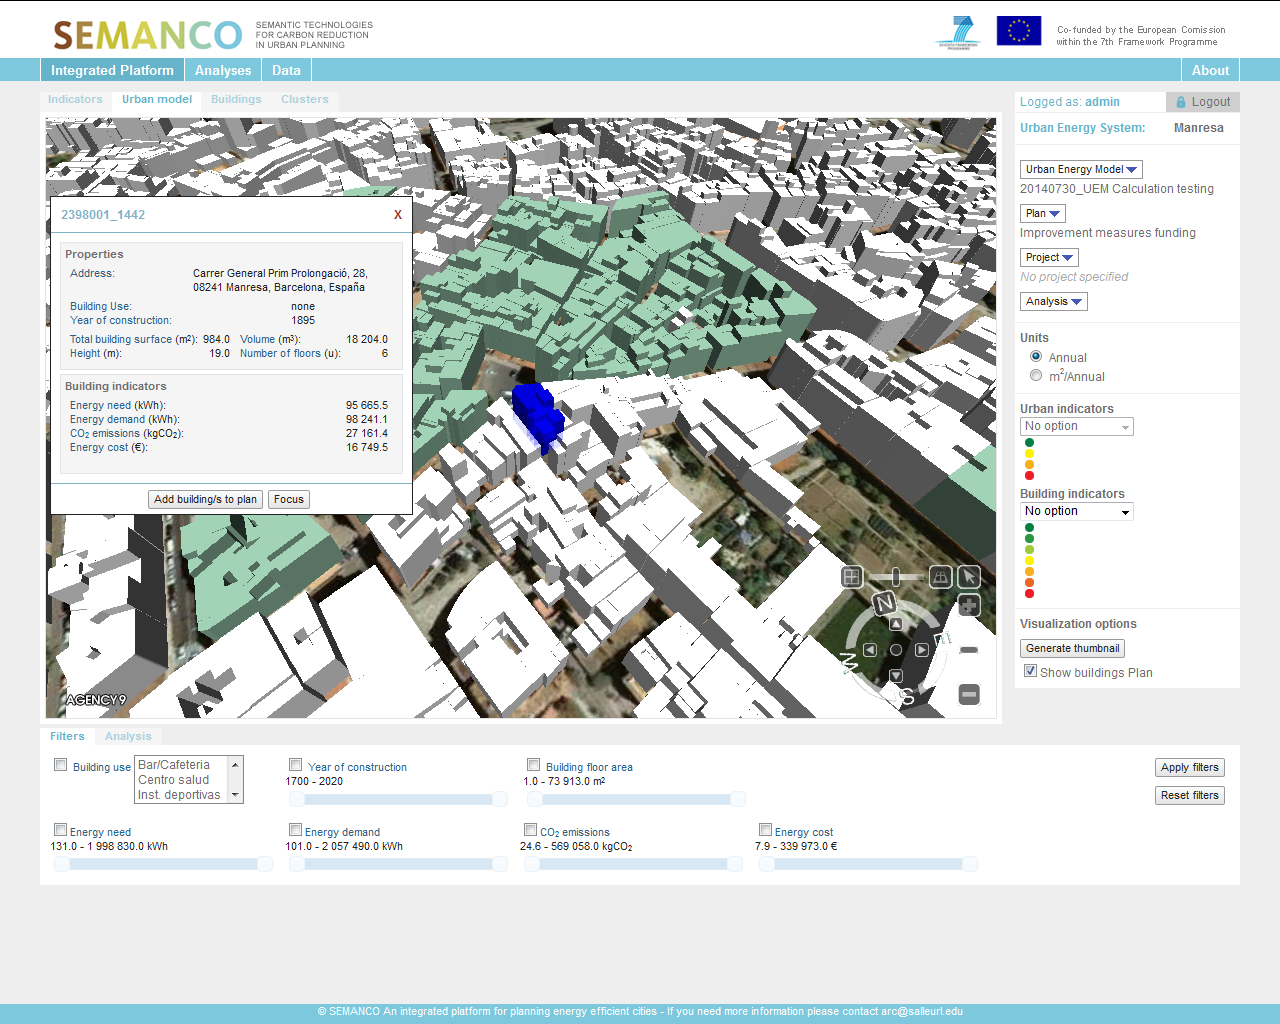
The user selects a large group of buildings in the area and adds them into the plan.
3.3 Plan overview
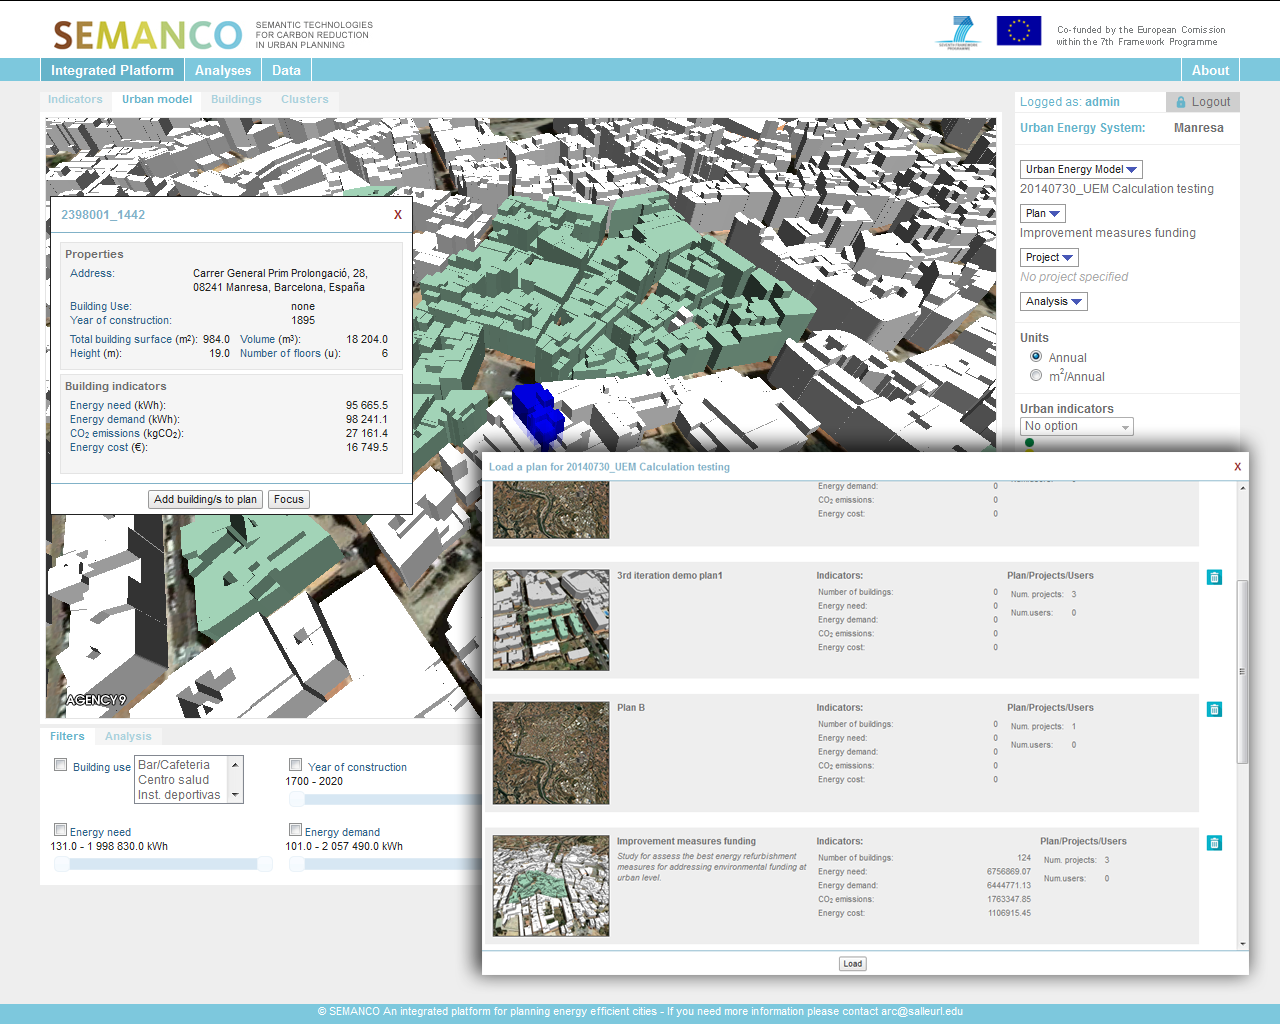
The result is a plan containing around one hundred buildings including many of the worst performing ones in terms of energy demand and carbon emissions. The SEMANCO platform can handle a large amount of buildings at once; however performing the calculations is time-consuming. Since the purpose of this application case is to test how certain refurbishment actions will impact on carbon reduction at large scales, the user decides that a sample of this size will be enough.
4. Applying pre-defined refurbishment options to projects.
Three projects are created considering the most common energy efficiently oriented options.
4.1 Creation of different projects
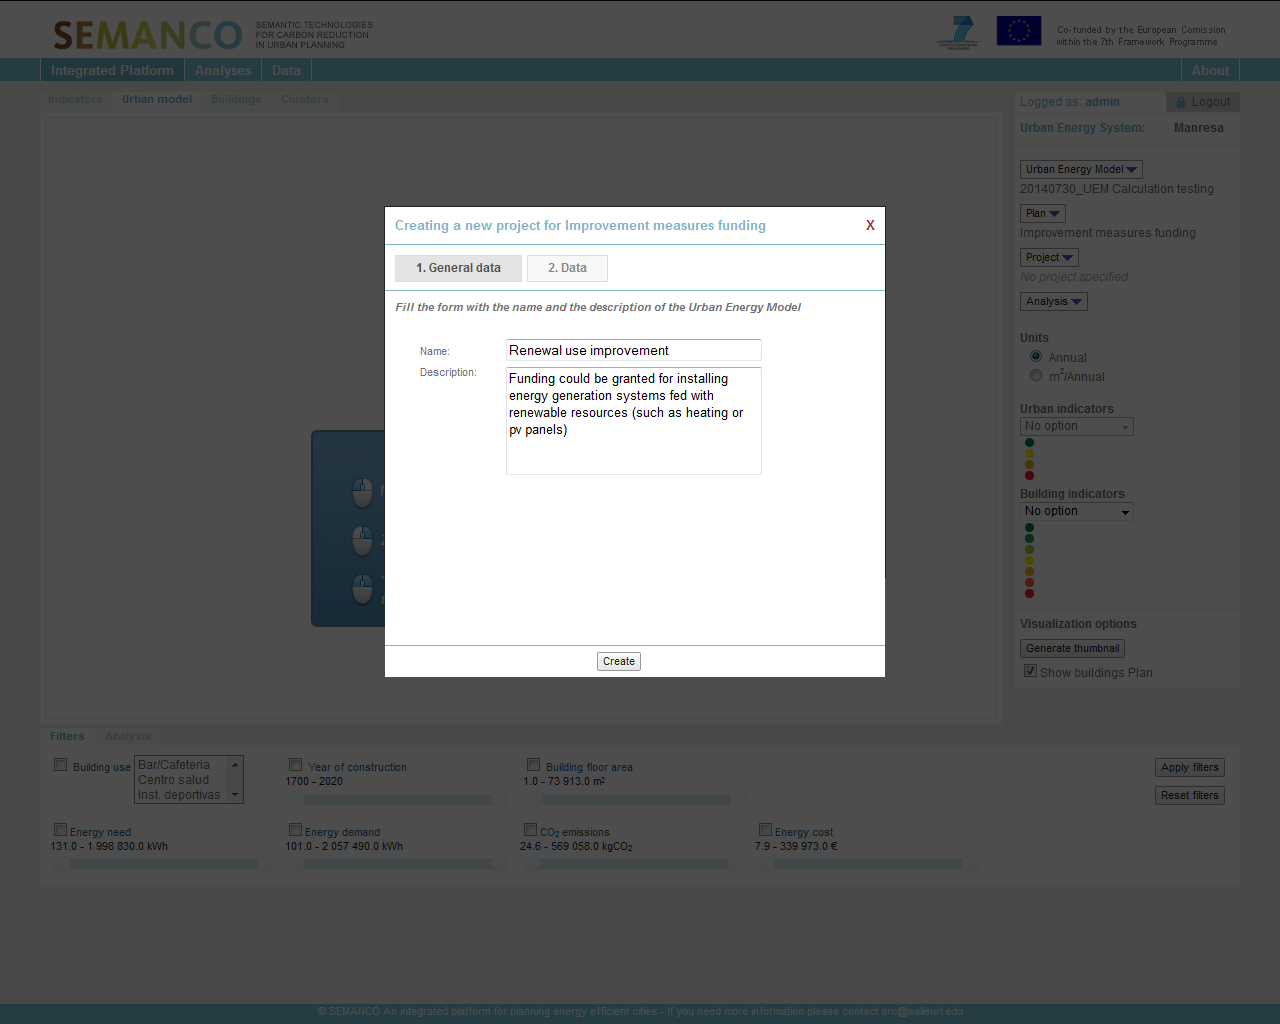
The user knows that historically the majority of investments to improve the energy efficiency of dwellings have focused on replacing windows and boilers. Therefore, the user creates projects oriented to those action lines. Firstly, the user creates a project to estimate the impact of changing glazing and frames for all the windows in the area. A second project considers replacing the existing boilers with new, energy efficient ones.
4.2 Applying pre-defined refurbishment options using USiT Improvement tool
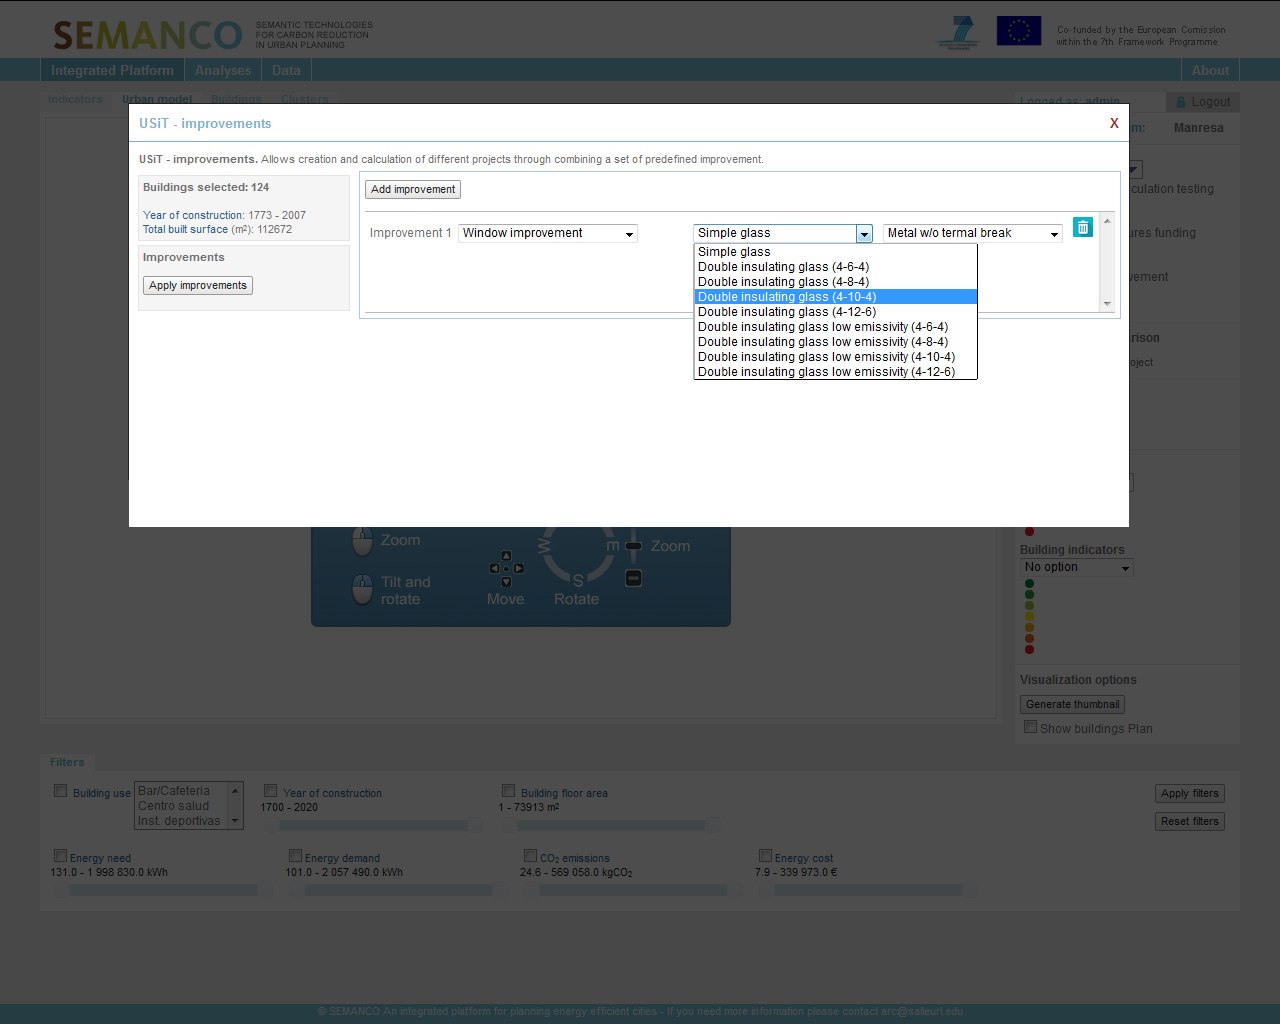
The user does not have a specialized background in energy performance, so s/he uses the “USiT Improvement tool”. This tool enables to change the current conditions of the buildings included in a plan and to assess the impact of those changes. This is done with just a few simple steps, selecting options from a set of drop-down lists. The user also adds a third project which considers the installation of solar panels in the buildings
4 3. Overview on the options
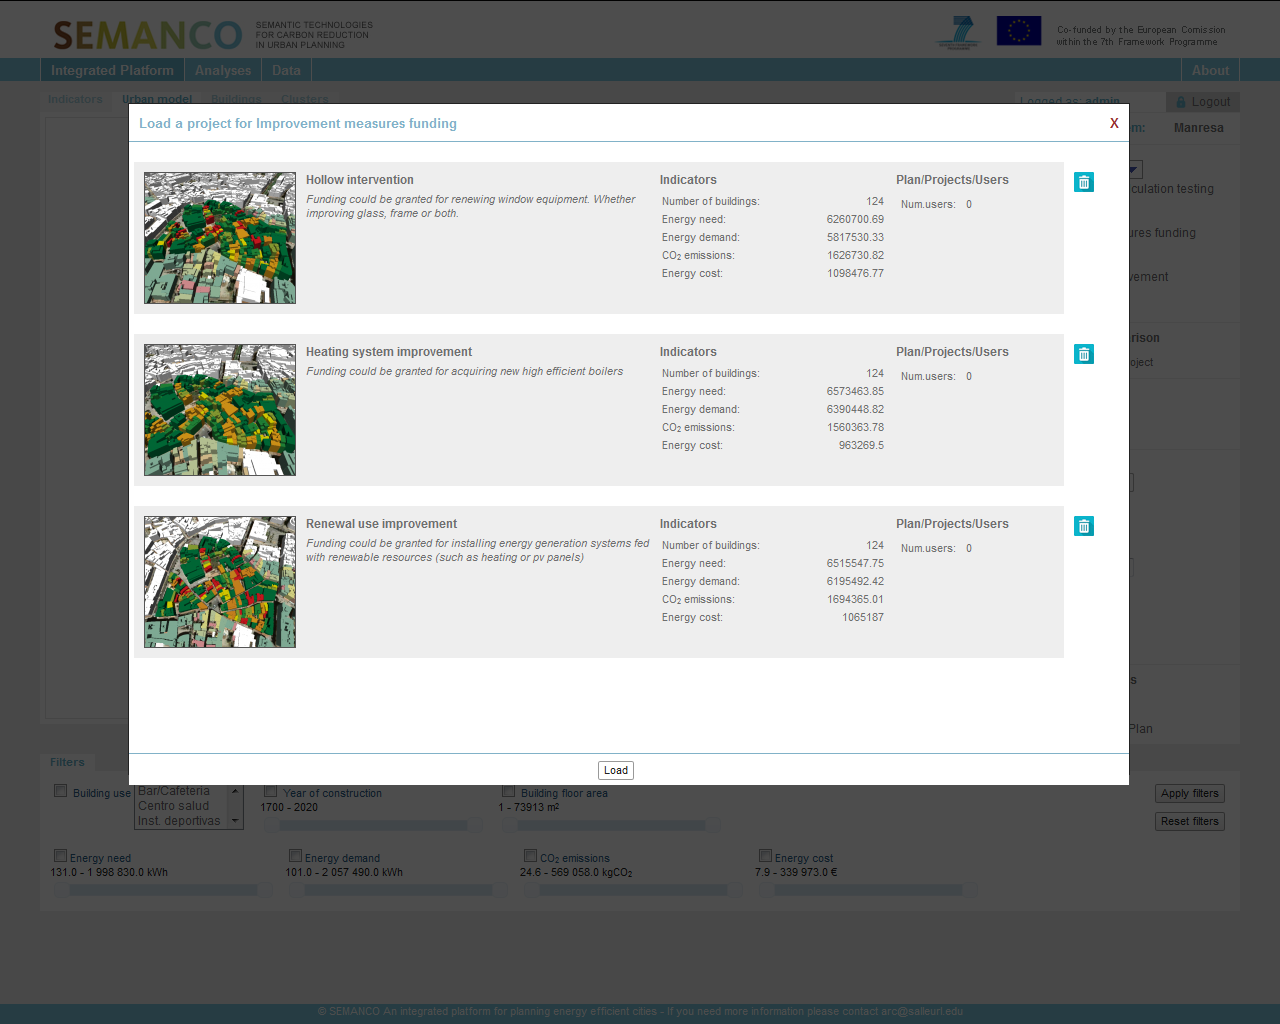
With the three projects in place and their impact calculated with the USiT tool, the user notices by looking at the table illustrating the outputs for each option that it is still difficult to make a decision based only on these figures.
5. Evaluating the different projects.
A new indicator is created and the three projects are compared.
5.1 Creation of a new analysis
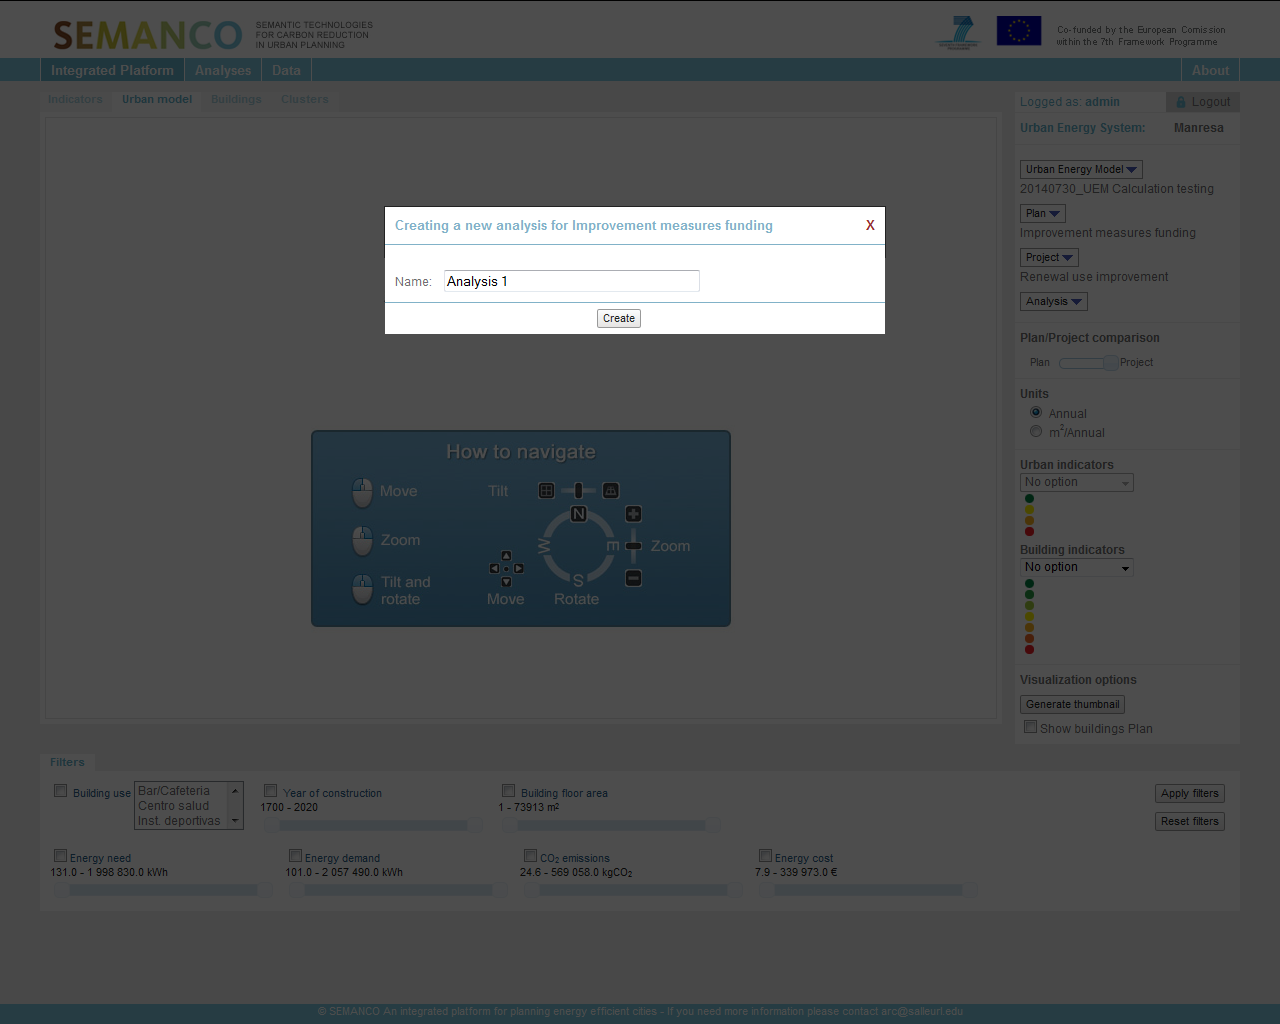
To compare the impacts of the three projects, the user chooses to compare the Multicriteria Decision Making tool (MCDM) is used. S/he begins by creating a new analysis. The user considers that the budget is a relevant indicator to compare the different projects.
5.2 Setting up the analysis
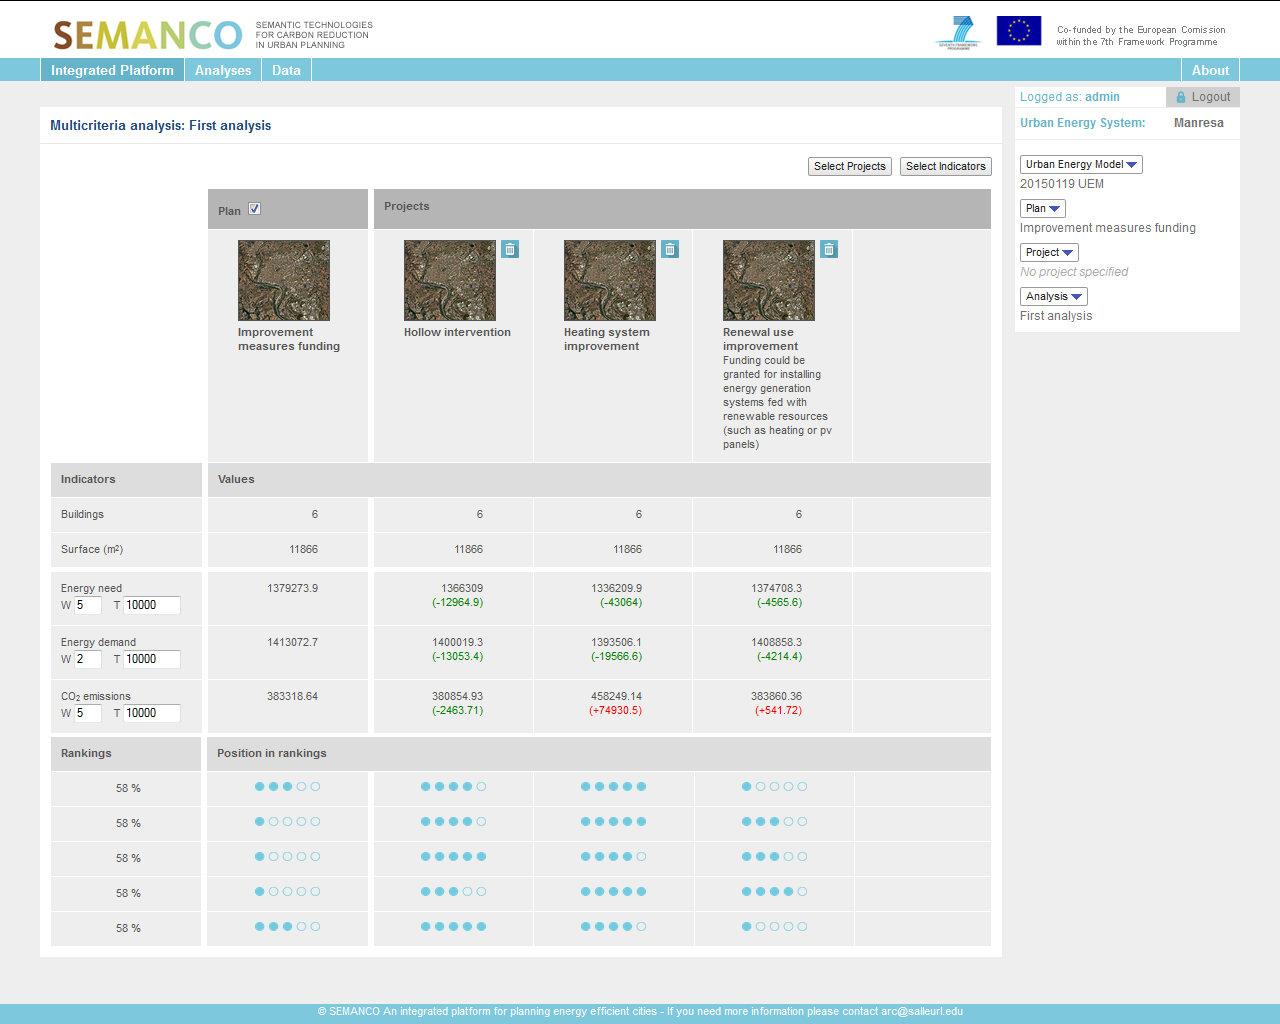
The user discards the baseline situation set by default. Then s/he fills in the parameters for each of the energy performance indicators which are significant for the comparison. The user sets both the weight and threshold of each indicator in a way that carbon emissions are treated as the most important. S/he does so due to the relevance that the Covenant of Mayors gives to this indicator.
5.3 Considering new indicators
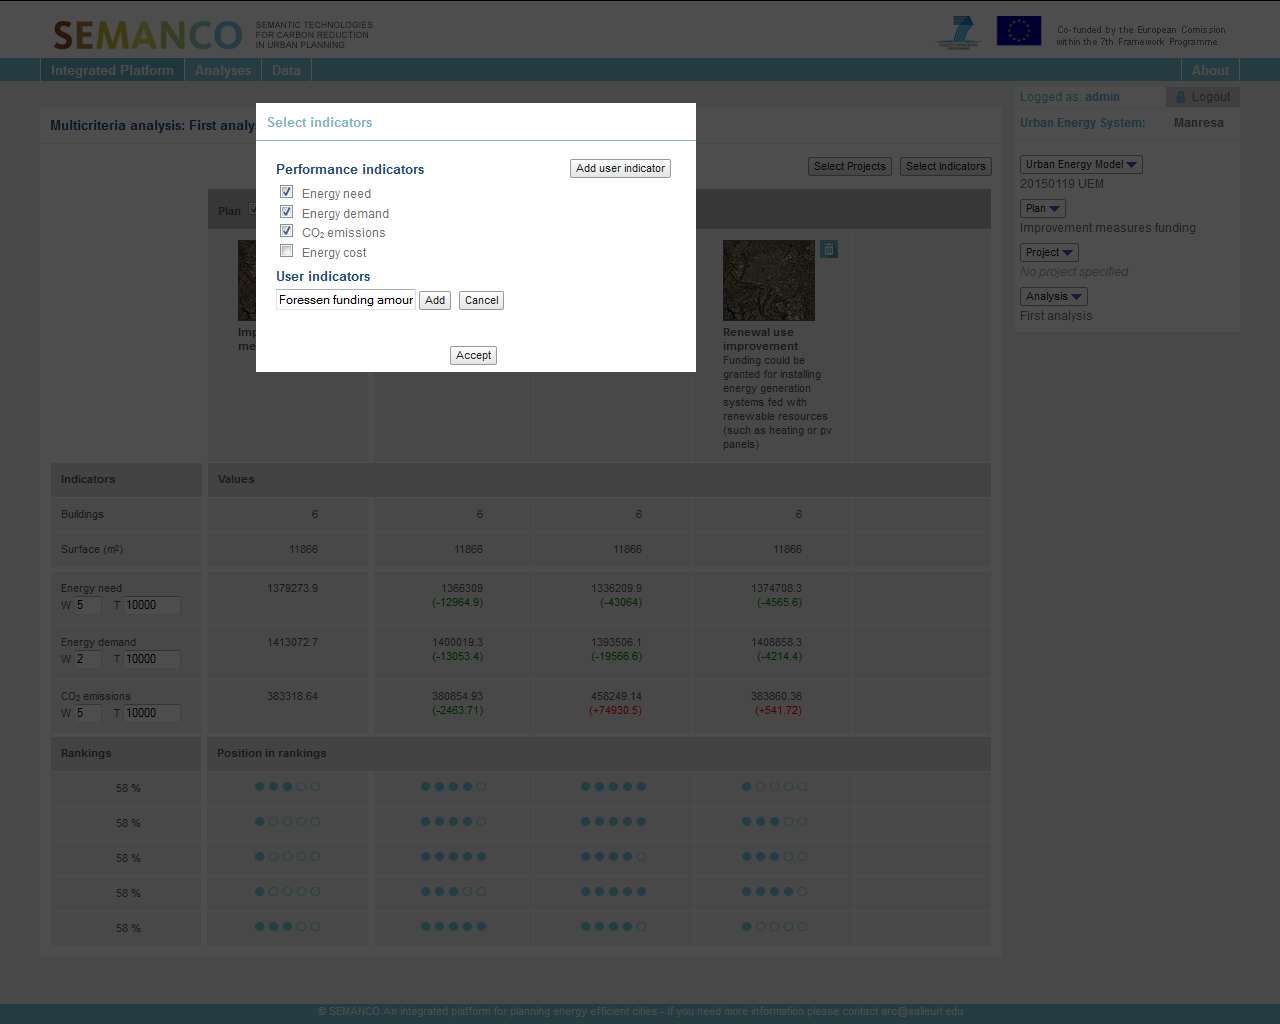
In addition, the user adds a ‘User defined indicator’ with the name ‘Foreseen funding amount’. The user sets the values of this indicator based on the experience gained in previous years providing funds to foster building refurbishments. The legacy of this experience means the user knows which options would be more attractive to investors among the projects being compared, and therefore s/he can pre-view how to better allocate the available funding.
5.4 Looking at the results
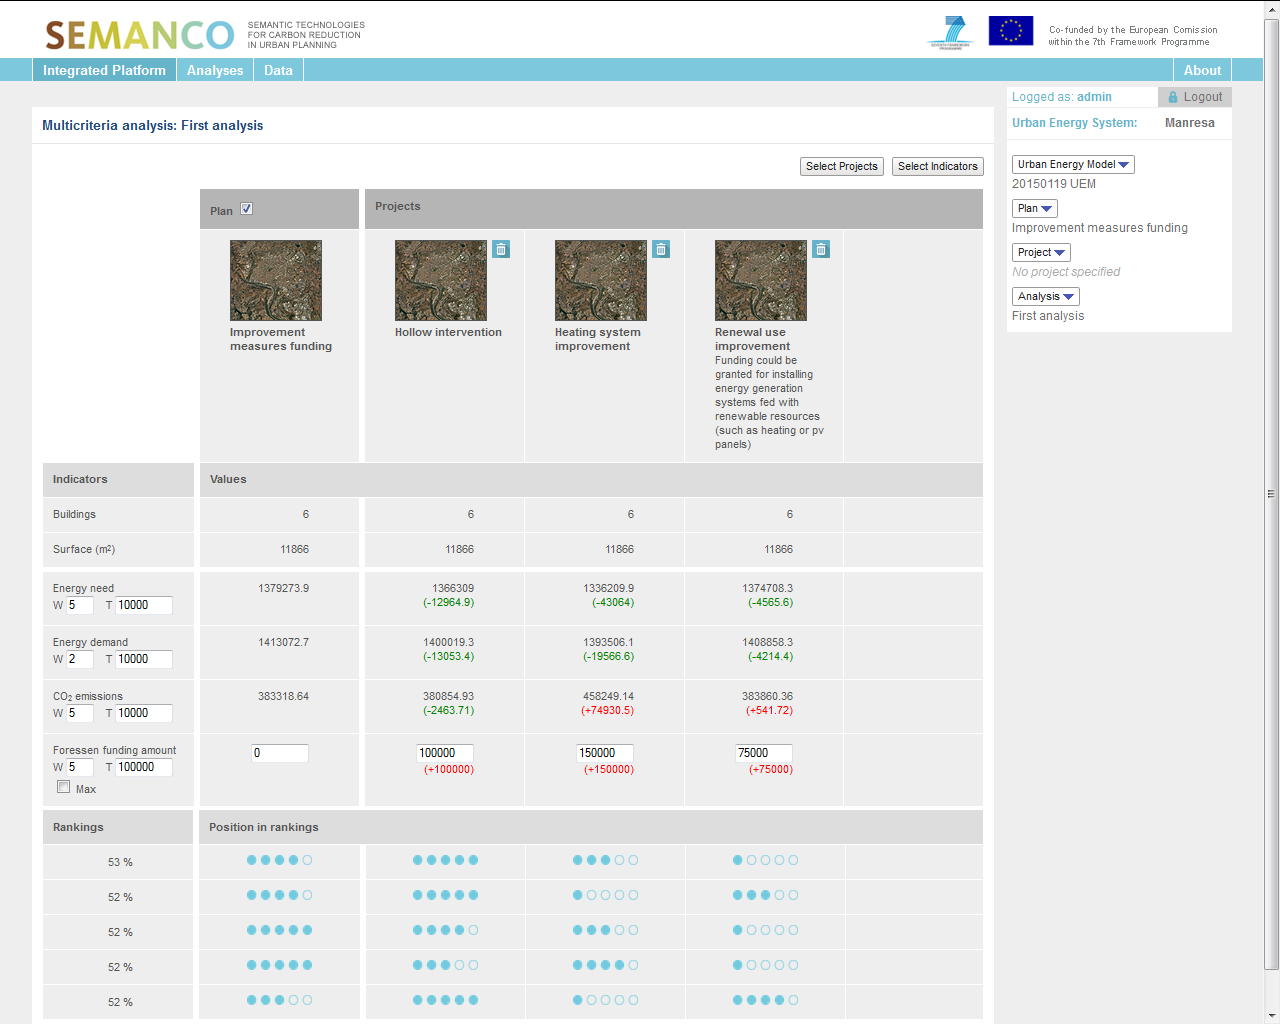
The results of the comparative analyses show that changing windows is the preferred option.. By changing the weight of the indicators, the user can test other options looking at how the ranking varies.
6. Looking at the results at a larger scale.
The impact in the neighbourhood containing the buildings is evaluated.
6. 1. Going back at urban level
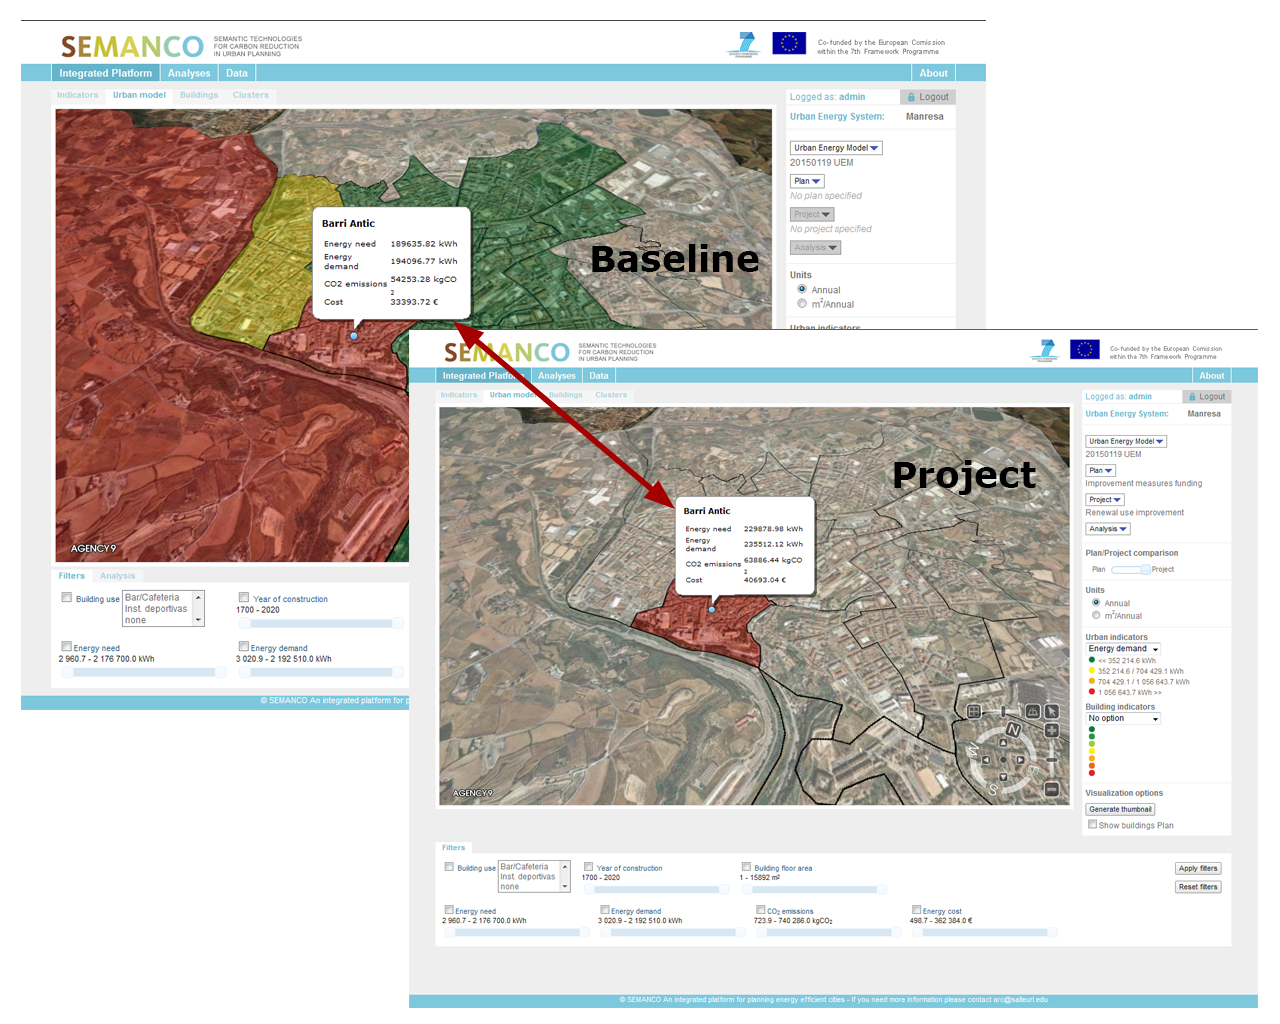
The user is keen to understand what savings can be achieved across the whole neighbourhood if the recommended project is finally implemented. To do so, the user goes back to the beginning of the process and compares the CO2 emissions values from the baseline against the project “Hollow intervention”.